Updated November 2026.
The Amazon Search Query Performance (SQP) report shows how shoppers move from a search to a purchase, and how much of each step your brand or product wins compared with everyone else. It lives in Brand Analytics in Seller Central. It is useful because it shows where you lose sales before you spend more on ads.
What is the Amazon Search Query Performance report?
SQP follows a search query through the shopper funnel. For each query it shows the total search volume and then your share of impressions, clicks, cart adds and purchases. Sources agree on this core idea, including guides from Clear Ads, SalesDuo and My Amazon Guy.
It is different from your ad reports. SQP combines paid and organic activity, and it does not split them. Clear Ads and SalesDuo both report that it covers organic results plus Sponsored Products. GigaBrands says it covers Sponsored Products only. Because sources disagree on exactly what counts, treat SQP as a guide to direction, not an exact match to your ad console.
Who can use it?
You need a brand enrolled in Brand Registry. Clear Ads adds that you also need the Brand Representative role and Brand Analytics permission, and that an Ads console login alone does not open it. SalesDuo adds that you need a Professional selling account and that access can vary by marketplace. Want a faster way to read your report? Try our free SQP analyzer.
The menu path reported by SalesDuo is Brands, then Brand Analytics, then Search Analytics, then Search Query Performance. Amazon changes menus often, so the path may look different when you read this.
What do the numbers mean?
| Step | What it counts | What a low share suggests |
|---|---|---|
| Search volume | How often shoppers searched the query | Not a problem. It tells you how big the prize is. |
| Impressions | Times your product was shown for that query | Visibility gap: rank, keywords, ad coverage |
| Clicks | Shoppers who opened your listing | Weak main image, title, price or reviews |
| Cart adds | Shoppers who added it to cart | Listing page does not convince: bullets, A+ content, price |
| Purchases | Shoppers who bought | Checkout friction: delivery time, price, stock |
Exports also include rates and median prices. Clear Ads reports that exports add median price and shipping speed fields.
Brand view or ASIN view?
Brand view shows queries across your whole catalogue. Use it to see which searches matter most for your brand. ASIN view shows one product. Use it when you want to fix a single listing.
A simple routine: start in Brand view to pick the queries with the most volume. Then switch to ASIN view for the product that should win that query.
How do you read it step by step?
Step 1: Pick a full time period
Weekly, monthly and quarterly periods are available. Wait until the period is complete. Clear Ads says Amazon reports data is generally available within 72 hours after the period ends, and the reporting week runs Sunday to Saturday. Other sources only say “a few days.”
Step 2: Sort by search volume
Do not chase small queries. Start with the ten to twenty queries where the most shoppers are searching.
Step 3: Compare the shares down the funnel
For each query, put impression share, click share, cart add share and purchase share side by side. The biggest drop between two steps is your leak. My Amazon Guy calls this the biggest drop between rungs, and Clear Ads describes four gaps: visibility, click, consideration and purchase.
Step 4: Fix the first leak
Fix the first step where share falls, before the later ones.
| Pattern | Likely cause | First fix |
|---|---|---|
| Low impression share | The listing is not found for this query | Add the query to title, bullets or backend terms. See our backend keywords guide. |
| Good impressions, low click share | Image, title or price does not stand out | Test the main image and title. |
| Good clicks, low cart add share | Page does not convince | Improve bullets, A+ content and reviews. |
| Good cart adds, low purchase share | Price, delivery time or stock | Check price against competitors and inventory. |
Step 5: Change one thing at a time
SalesDuo warns against changing many listing elements at once, because you will not know what worked. Make one change, then check the next full period.
How do you use SQP with PPC?
SQP does not replace your search term report. They answer different questions. The search term report shows what you paid for. SQP shows what shoppers did across the whole results page.
Clear Ads suggests a workflow. Pick a completed period, export your Brand and ASIN views, export the Sponsored Products search term report for the same dates, and match queries. Then compare ad cost and ACoS with your funnel shares.
Here is how to use that in practice.
High volume, low impression share. This is a visibility gap. Check whether you are bidding on that query at all. Our guide on Amazon PPC strategy explains how to structure campaigns by intent.
Good share but high ACoS. You may be paying for traffic you would win anyway. Check whether you are bidding on your own brand terms. See how to reduce ACoS on Amazon.
Low click share against a strong competitor. Fix the listing before raising bids. More bids on a weak listing just buy more clicks that do not convert.
Common mistakes
Several guides repeat the same warnings.
Reading share without volume. A 40% share of a tiny query is not worth much. Clear Ads lists this as a common mistake.
Treating one week as a trend. My Amazon Guy and SalesDuo both warn about overreacting to short periods. Look at several weeks.
Expecting numbers to match your ad console. SQP and ad reports use different definitions. They will not match.
Branded keywords inflating your share. Your own brand name will show a high share. Look at generic queries to see real competition.
Treating brand share as category share. Your share is your share of that query, not of the whole category.
Where do sources disagree?
Be careful with exact figures.
The query limit: Clear Ads says “up to 1,000 queries,” depending on catalogue size. GigaBrands says a flat 1,000. Data history: GigaBrands says about 18 months, but Nova Analytics says it keeps 13 months for its own users, which is not the same thing. Ad scope: GigaBrands says Sponsored Products only, while Clear Ads and SalesDuo say organic plus Sponsored Products. Also, almost every source sells PPC or software, and client results they mention are not independently checked. Check Amazon’s own help pages for current limits.
How often should you check it?
One simple rhythm, based on My Amazon Guy’s suggestion: look at weekly shares for your top twenty queries, check the purchase-share trend monthly, and compare Brand and ASIN views quarterly. Log every change you make, so you can connect it to a result.
Final word
SQP will not fix your listing for you. It tells you where to look. If your problem is visibility, work on keywords and ad coverage. If it is clicks, work on images and price. If it is purchases, look at delivery and stock. If you want a team to run this analysis for you each month, see our Amazon PPC management service or our Amazon listing SEO service.
Real results from brands we work with
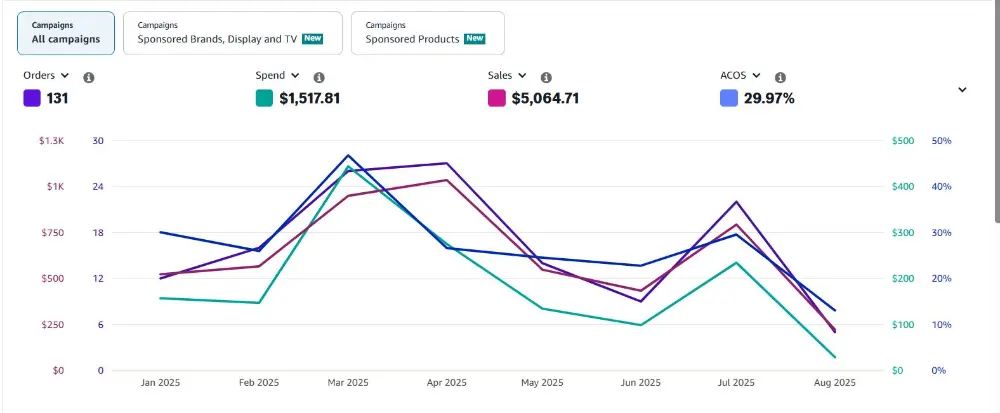
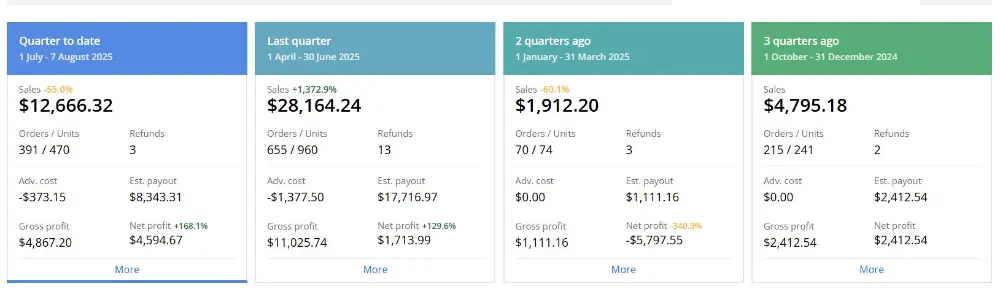
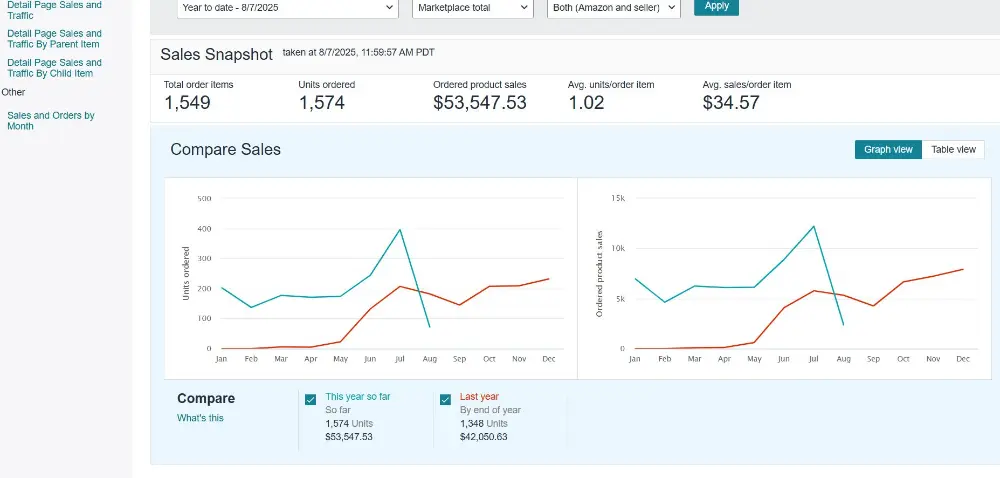
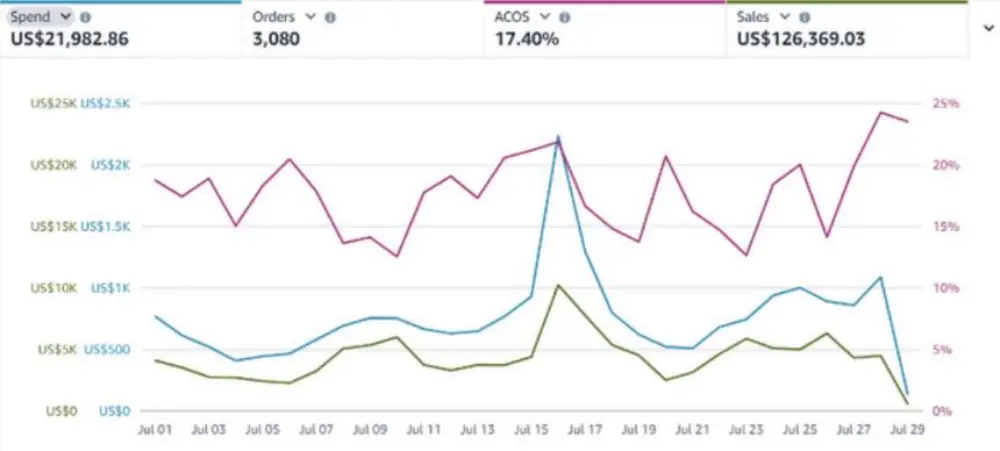
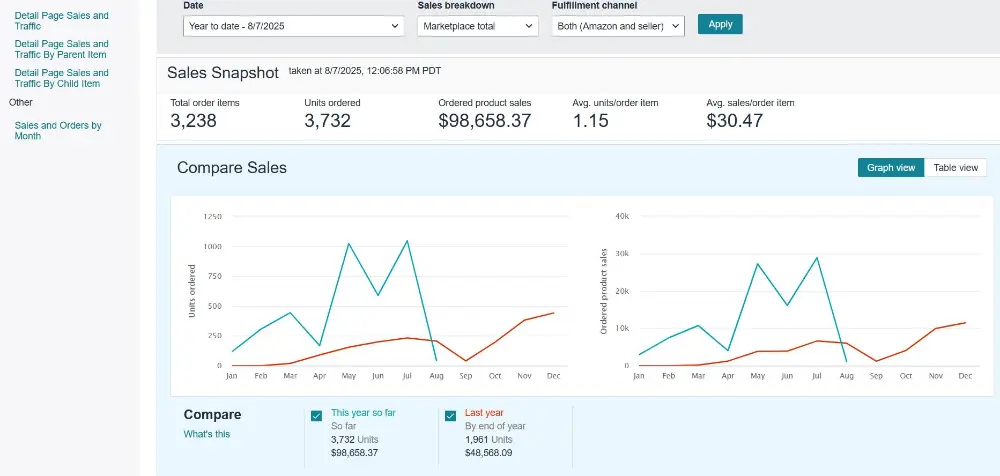
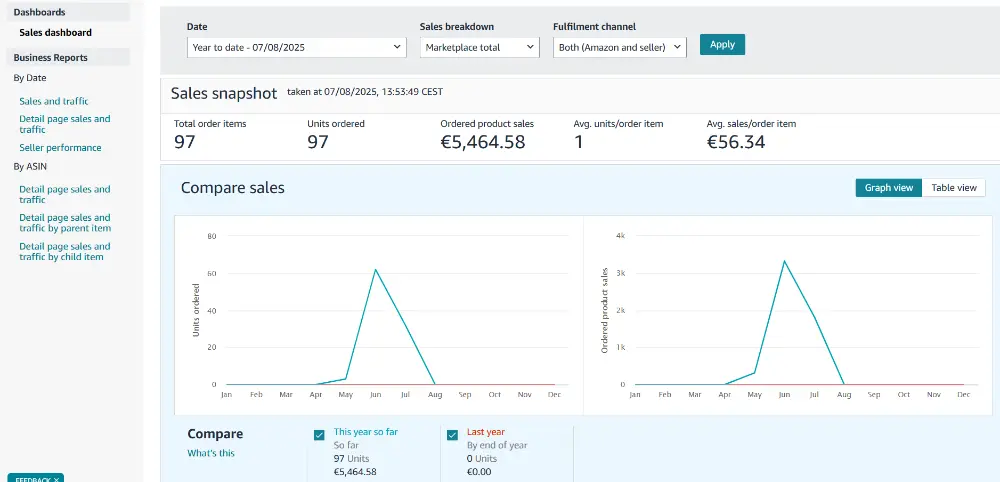
Screenshots from accounts we manage. Results vary by category, price and starting point.
Frequently asked questions
What is the Amazon Search Query Performance report?
It is a Brand Analytics report that shows your share of impressions, clicks, cart adds and purchases for each search query.
Who can access it?
Brands enrolled in Brand Registry, with the right Brand Analytics permission. Sources say access can vary by marketplace.
Does SQP include ad traffic?
Yes, it combines organic results and ads. Sources disagree on which ad types are counted, so do not expect a match with your ad console.
What is the difference between Brand view and ASIN view?
Brand view covers queries across your catalogue. ASIN view shows one product.
How long until the data appears?
Clear Ads reports Amazon says data is generally available within 72 hours after the period ends. Other guides say a few days.
How many queries does it show?
Sources say up to about 1,000. One says it depends on your catalogue size. Check Amazon’s help page for the current limit.
Is SQP the same as the search term report?
No. The search term report shows queries that triggered your ads. SQP shows how your listing performed across the funnel for each query.
How often should I check it?
Weekly for your top queries, monthly for trends and quarterly for a bigger review. Do not judge by one week.
Ready to See What Your Ad Account Could Actually Do?
Get a free, no-obligation audit of your Amazon PPC account, we’ll show you exactly where you’re leaving money on the table and what a real strategy would look like.
- Takes less than a minute to submit
- No obligation, no pressure, just a real look at your account
- We’ll tell you honestly if we’re a good fit

The Smart Sellers Edge
AI breakthroughs that help smart Amazon sellers outsell the competition.